What You Need to Know about the AI Buildout
a white paper
by Jennifer Warren, Concept elemental
Early September, 2026

PDF Download
Click image
Several storylines about the AI infrastructure buildout intersect, overlap and are conflated based on the stakeholder group. This reporting highlights specific aspects related to investors and risktakers, focused on the way in which the technology is changing. If you don’t understand how this is moving, much of the rest won’t matter. Additionally, some of the economics of how investment is coalescing will be discussed. These are new directions, with many rabbit holes. This general guide serves to help identify one’s place in the changes ahead.
In published work early in 2026 and 2025 about the buildout, I referenced the concepts about scale, but were not detailed in the original works. Those ideas matter for this discussion to ground what is happening. Four forces are building atop each other[i]:
• the power of the Internet, with search changing;
• mobile apps and mobility;
• cloud infrastructure growth and changes;
• AI technology bucket, which includes generative AI, machine learning, and many more technologies. (See timeline of AI buildout at end.)
Technology pacings
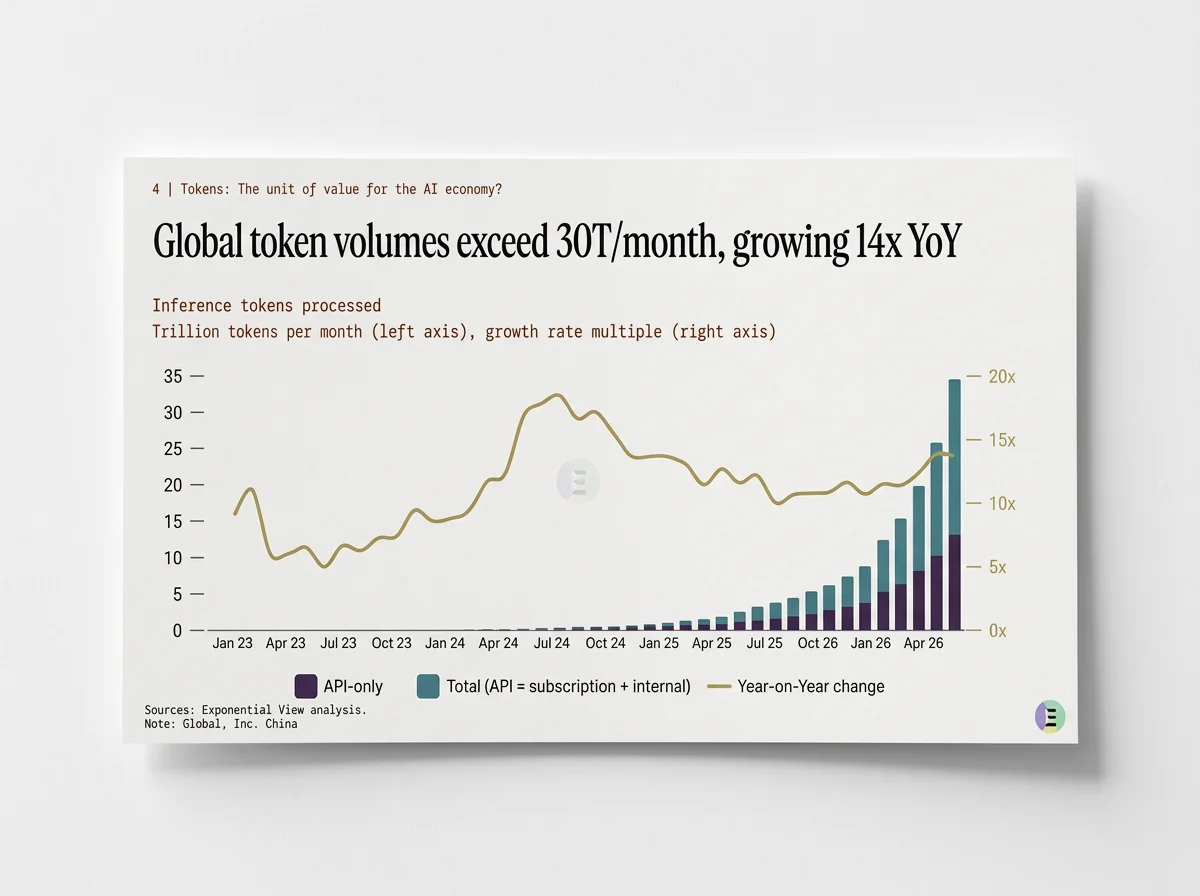
Importantly, the growth curves of each aspect are creating synergies yet to be determined. Nasdaq[ii] reports that the “AI industry” is pacing three times faster than the top three buckets noted above. The expansion of token volume is a proxy for this growth. In the chart, note that “API-only” is developer use. Most tokens were largely in training output before early 2025, ie., inference wasn’t on the books just yet.
Whether a token is open or closed-source, it still requires the same chips and associated infrastructure to produce, and in some cases more. Models’ competition is fierce. Nasdaq says:
“the biggest risk to further upside resides with the closed-model frontier players, their ability to remain at the frontier preserves their pricing power, as more and more open-source-powered AI agents proliferate and require “higher IQ” teachers, coordinators, and supervisors to help them deliver value-add.”
Closed models are like Anthropic’s Claude and OpenAI’s GPT-4 and 5.
Agentic AI and tokenomics are a storyline left for another day, but an indication is ahead. According to Goldman Sachs, token use by AI agents is forecast to grow 24x by 2030. Importantly, frontier models determine what tokens should come next. The infrastructure, and specifically memory bandwidth, determines how fast and how cheaply those tokens can actually be produced at scale.
Financial metrics indicate growth
Top hyperscaler’s Microsoft and Amazon share prices rallied by 25% each at the end of July owing to strong growth rates in their cloud services businesses (43% and 37% yoy, respectively). Their capex commitments were nearly $200 billion each. Overall, AI revenue across the foundational model, infrastructure, and application layers is compounding at more than $1B every two days in 2026, approximately 90x faster than it was in 2023. Again, this is unique and the costs to support this build out is large.
More granularly, the ability of data centers to crank out revenue is increasing. In just two years, revenue per energized data center increased from $4 billion to nearly $8 billion. Said another way, industry-wide revenue of data center capacity was $7 billion per GW, a doubling in the past 18 months. This indicates how fast the technologies and innovative approaches are moving. We have no idea when a sort of maturity sets in.
Returns on investment across the value chain are going higher. Nasdaq cites that “Amazon recently made news by raising prices on GPU instances within its AWS unit by 20%.” (However, this price hike is capturing value from demand that's outstripping available Nvidia capacity relative to GPU rentals on training blocks.) In July, Morgan Stanley Research released an analysis of three different emerging AI business models:
1) models running on third-party rented infrastructure: ~25% return-on-invested-capital (ROIC);
2) hyperscaler GPU rental model (Iaas, infrastructure as a service) 31% ROIC;
3) models running on owned infrastructure 46% ROIC.[iii]
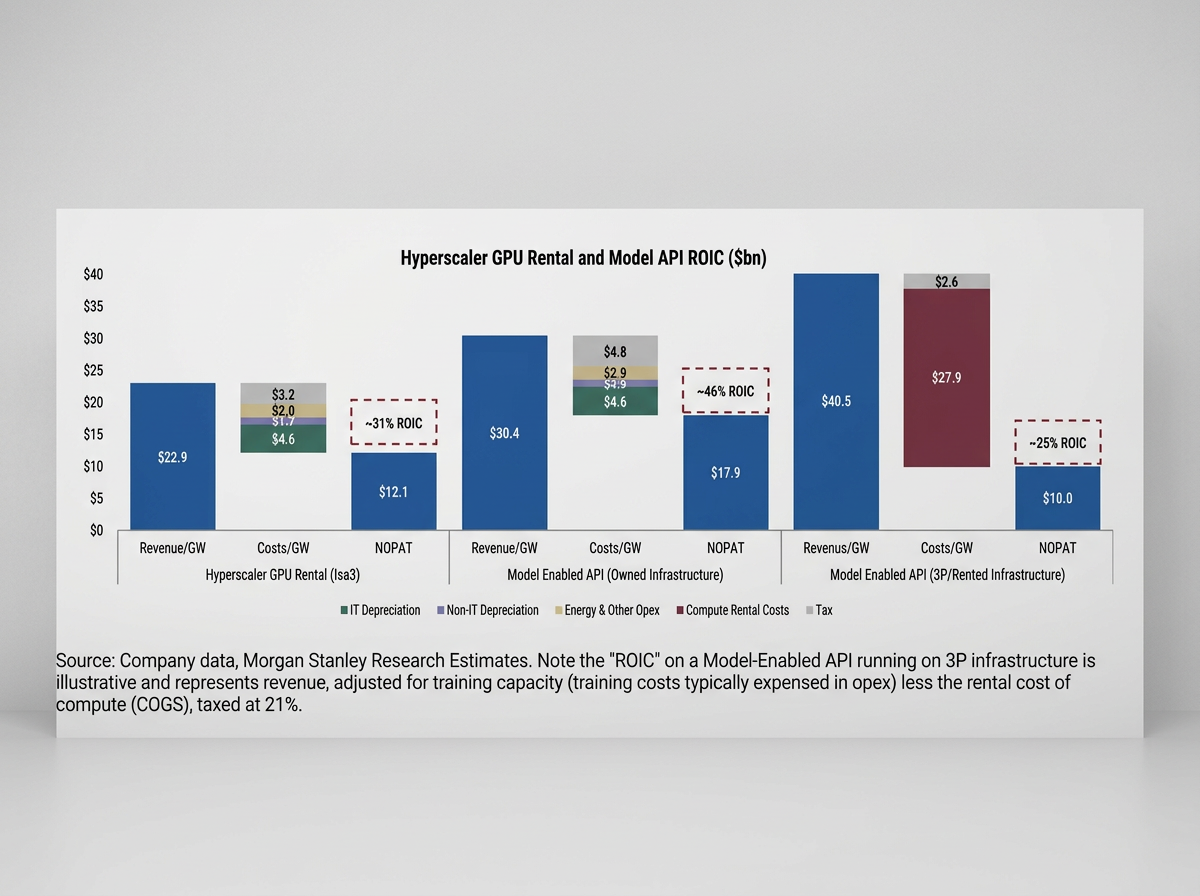
Noteworthy are the estimates of $40 billion, $23 billion and $30 billion, respectively, earned per GW of capacity by these model types. The associated costs to serve this revenue were also estimated. In two cases, an ‘energy and ops cost’ bucket were $2 billion per GW. Interesting, both Anthropic and OpenAI are developing their own data centers, effectively controlling multiples aspects of their future ROI and technological IP learnings.
This scarce capacity and value of capacity trend[iv] was emerging in the fall of 2025, but it’s first inkling was expressed in a room at an AI Summit in Oklahoma by an Anthropic cofounder. This compute capacity scarcity dynamic is a morphing trend unto itself.
Select chip and digital infrastructure dynamics
Some of the ‘obsolescence of chips story’ of fast depreciation is changing. Chips are responding to intellectual property enhancements, such as software upgrades, helping extend their productivity over longer time horizons. Operational innovations are emerging to optimize the mix of chips, networking, power flow and cooling to squeeze out the maximum possible yields. Data center developers, including those that shifted from bitcoin mining, are innovating in the operational space and identifying new business models.
In a recent interview with a developer executive, he confirmed that roughly 75%-80% of the spending on a compute GW is the IT equipment, chips, and networking. The remaining 20% is the land, shell and related heating and cooling infrastructure. A rough estimate is $50 billion per GW of all-in cost. However, increased memory chip constraints have raised prices, with numbers cited of 15-20%. Top memory chipmakers Samsung and SK hynix raised HBM3E supply prices by nearly 20% for 2026. Even Apple had to raise prices owing to memory chips.
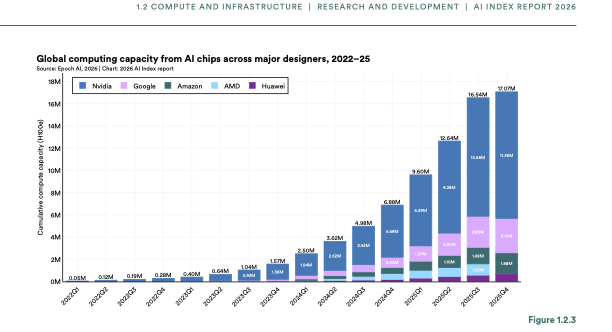
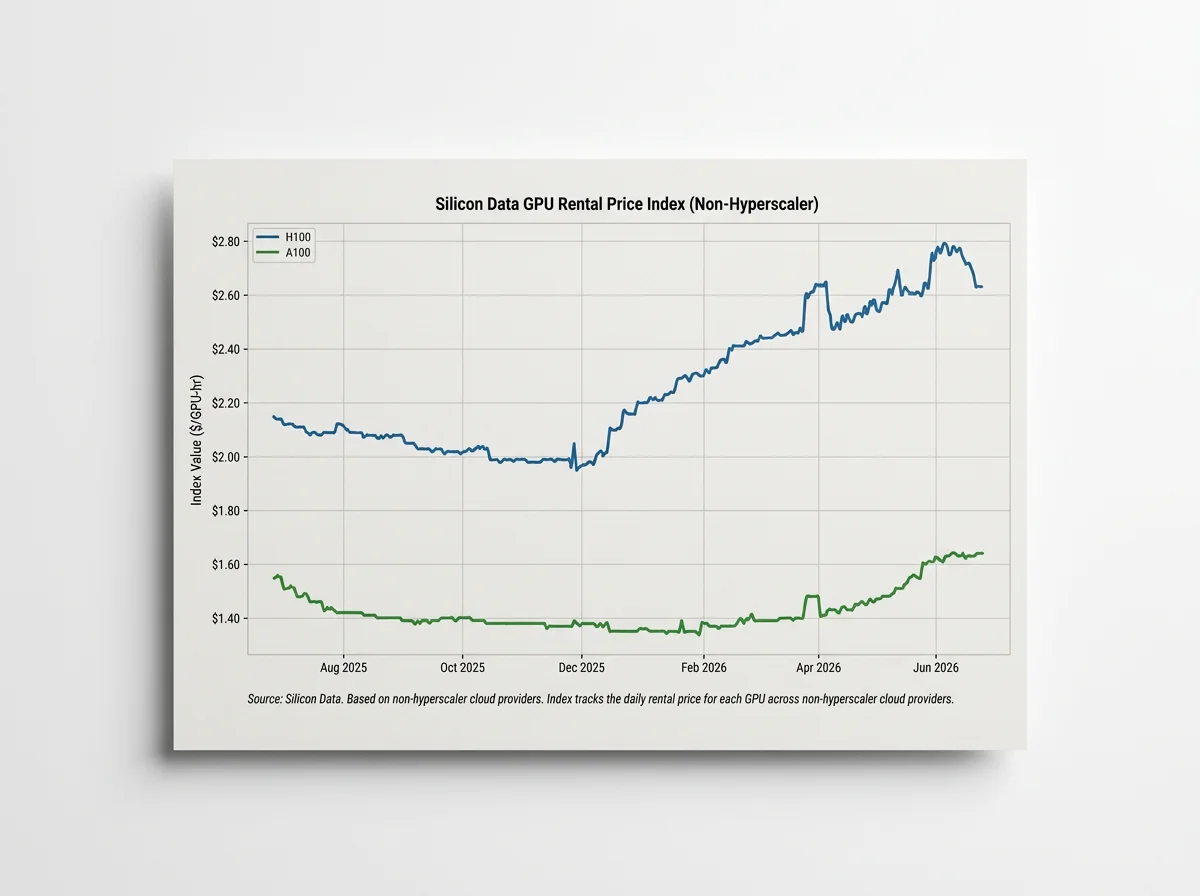
Still, optimization is continuing to increase with each newer generation of chips sourced into the data center market. Below H100s, the blue line is newer chip generations than A100s.
Further evidence beyond Nvidia comes from rival Broadcom, with a focus on custom silicon. From a recent earnings call, they project ~30 GW aggregate demand across six customers (Google, Anthropic, OpenAI, Meta, Microsoft, and Amazon), translating to a $350B two-year shipment commitment. Interestingly, the dollar-content per gigawatt is stable at $20–30B across generations of their offerings. Chips are becoming more powerful and growth is resulting from more gigawatts deployed, not price expansion. While Broadcom expects to ship $350 billion in goods, the actual 30 GW figure is discounted with site-readiness (land, power, shell construction) as the binding constraint.
Custom silicon, ASICs and XPUs, are shifting from a niche hyperscaler side-project into the primary vehicle for frontier-lab compute buildout. Broadcom is positioning itself as a main actor in that shift. Frontier labs are becoming vertically-integrated compute companies. The CEO noted that labs will eventually look "no different from a hyperscaler.” There’s much behind that statement—and it’s novel.
The Factor of Time
The timing of the capital spending matters about when data centers come online and their funding. In recent articles, when asked about timelines, executives in “The New Barons…” suggest a longer arc than media headlines and headline numbers, like interconnection queues, portray. This mismatch is key to understanding how the cadence of investing and the ability to stand up a data center evolve. Will capital be tight before the physical constraints of the infrastructure being built? These answers will likely emerge in the next year, and after the election.
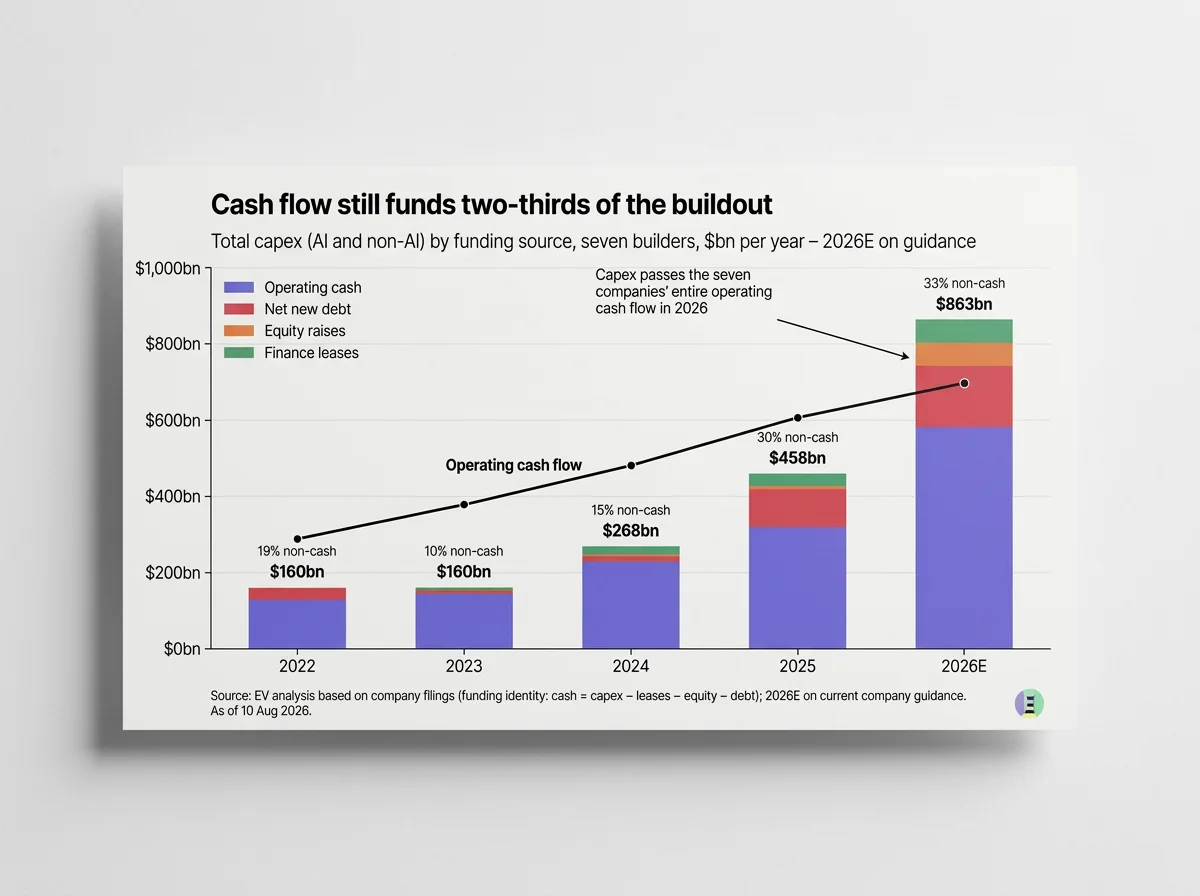
The performance of the advancing technologies is underrepresented in the public’s knowledge bank. A timing mismatch exists in capex spending versus the payoff, with datacenters requiring 18-24 months to build and sometimes longer to energize. Cash flows generated this year are largely sourced by capex spent two or more years ago, on less efficient and less powerful GPUs. Of the upcoming years’ capex, Nvidia notes a 10x increase in throughput per second per megawatt on the Vera Rubin chip, with more favorable payoffs in terms of revenue, profit, and cash flows in 2028 and beyond. The Nasdaq analyst suggests leverage levels are still low, with the increase in debt accompanying a corresponding increase in EBITDA.
Since the beginning of 2023, AI research provider Epoch AI suggests the performance per dollar of AI chips has improved by at least 49% per year, on average. That is one baseline. [However, like any good economic model, there are eventually diminishing returns.] Notably, the cost of tokens is reducing in many cases.
Bottomline: speed to power is a completely understandable business imperative. With big tech, modelmakers, and developers eager to secure market position, the competition as a first mover of sorts is heated. Financial analysts are attempting to identify, model and forecast the meaning of it all. Grounding, literally, is required.
Rate of change in physical world
Current regulatory headwinds, which includes the upcoming vote, will likely mitigate boom-bust given the nature of this buildout. It involves considerably more moving parts of the economy than say, an oil and gas boom. However, consumers have benefited greatly from lower priced oil, gas, and energy prices, owing to shale. Investors took the hit in the early part of the shale boom, characterized by some as capital destruction.
Looking back over a decade, the shale revolution is the pillar under which the U.S. has powered through less scathed than the rest of the world in crisis, particularly compared to Europe and Asia. In fact, it is likely the differentiator as to why the US is continuing a build out that would have choked without the resources and energy infrastructure in existence. The buildout is helping give support to the energy and construction industries on order of magnitude of 100,000s of jobs.
The following chart was part of the Nasdaq September 2026 report and a deeper more updated look is required. They compare three analyst houses. I’ve included the original RAND chart too afterward.
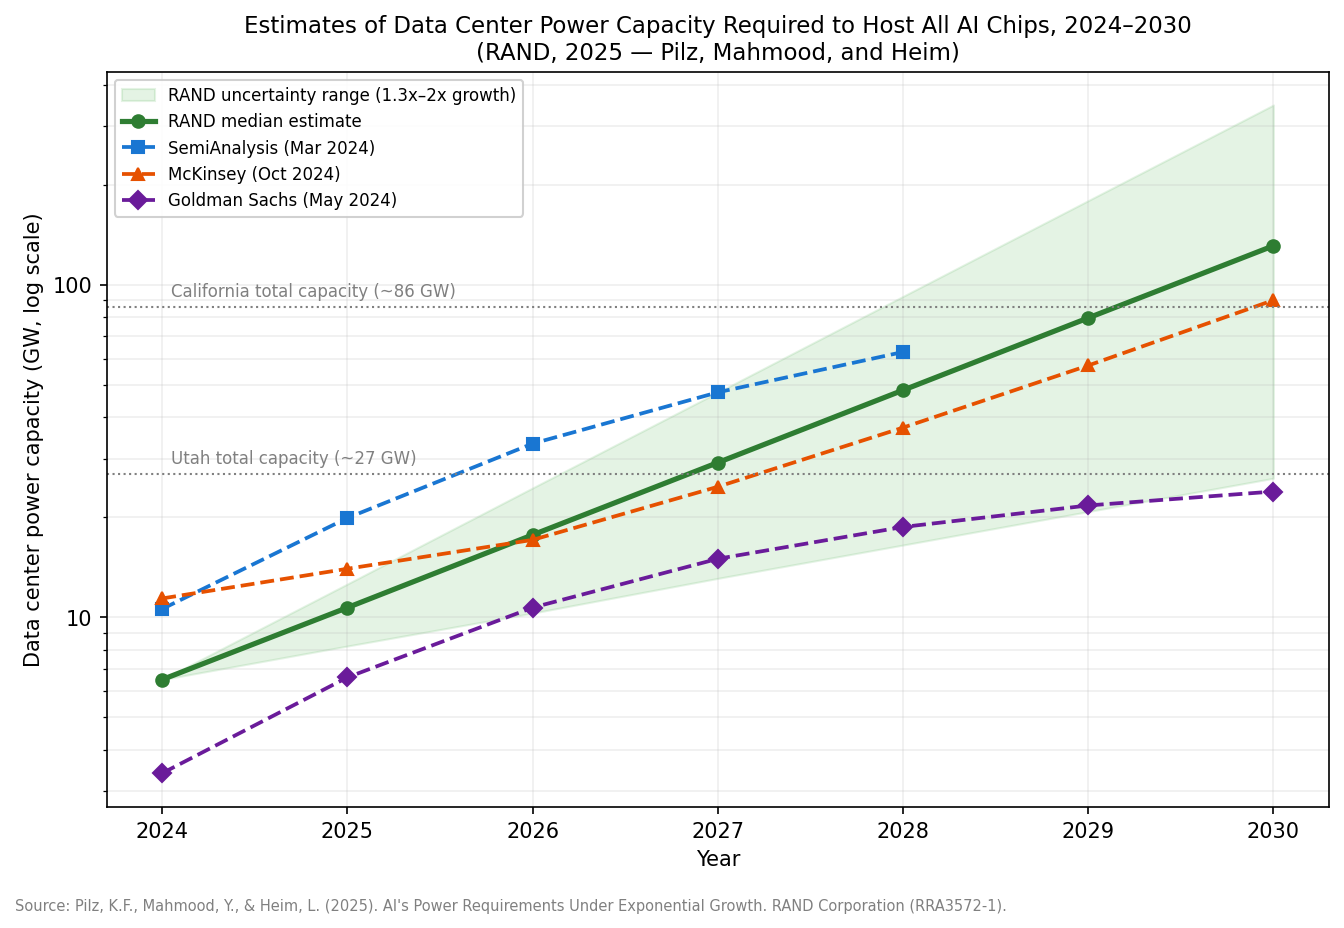
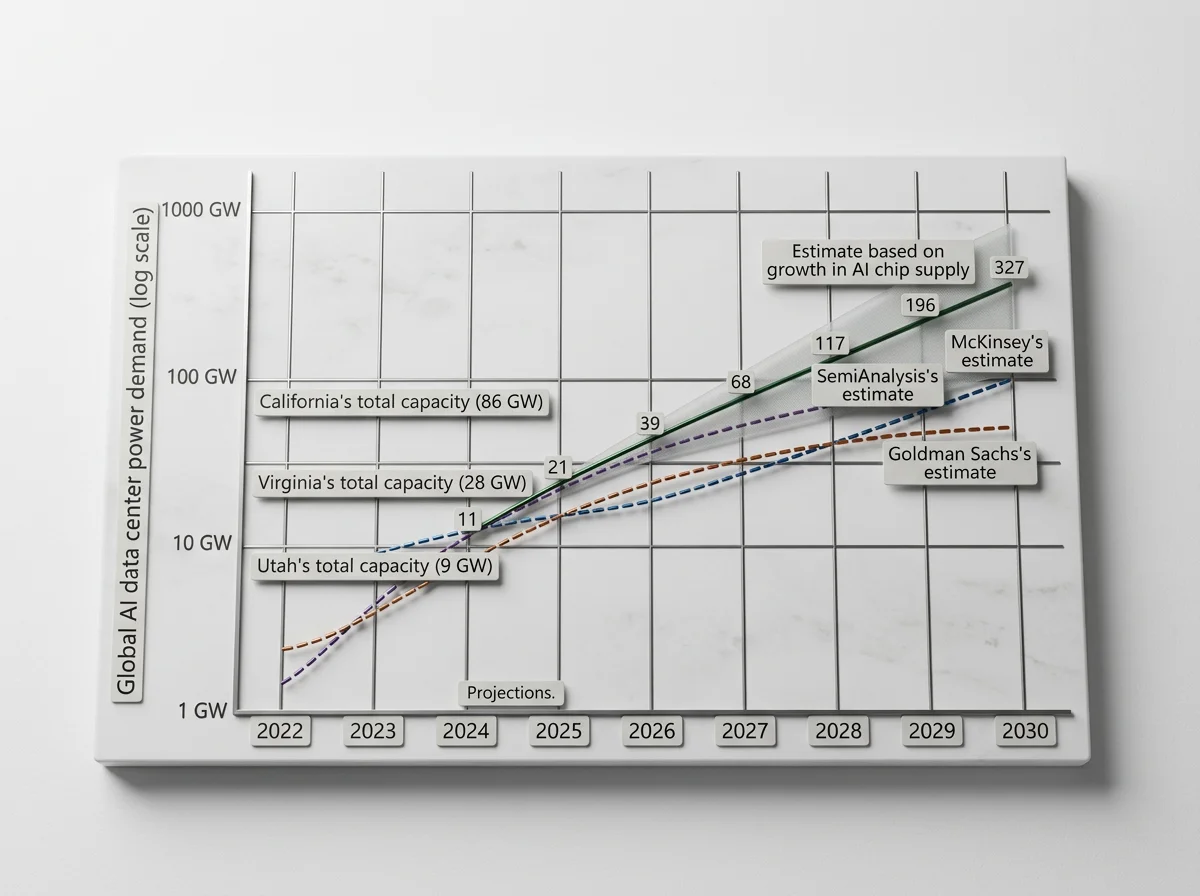
RAND’s numbers were global and based on the following.
The three external estimates cited in RAND's above are derived from:
~62 GW by 2027: SemiAnalysis (Patel, Nishball, and Ontiveros) — published March 13, 2024, "AI Datacenter Energy Dilemma—Race for AI Datacenter Space"
~24 GW by 2030: Goldman Sachs — published May 14, 2024, "AI Is Poised to Drive 160% Increase in Data Center Power Demand"
~90 GW by 2030: McKinsey (Srivathsan et al.) — published October 29, 2024, "AI Power: Expanding Data Center Capacity to Meet Growing Demand"
So all three predate RAND's own report (published 2025) and were released within about an eight-month window in 2024, with McKinsey's being the most recent of the three at the time RAND compiled the comparison.
Further the report notes this reflects AI-specific data center demand only — traditional data centers are growing separately by about 5 GW/year on top of this. I ran updates with Claude below.
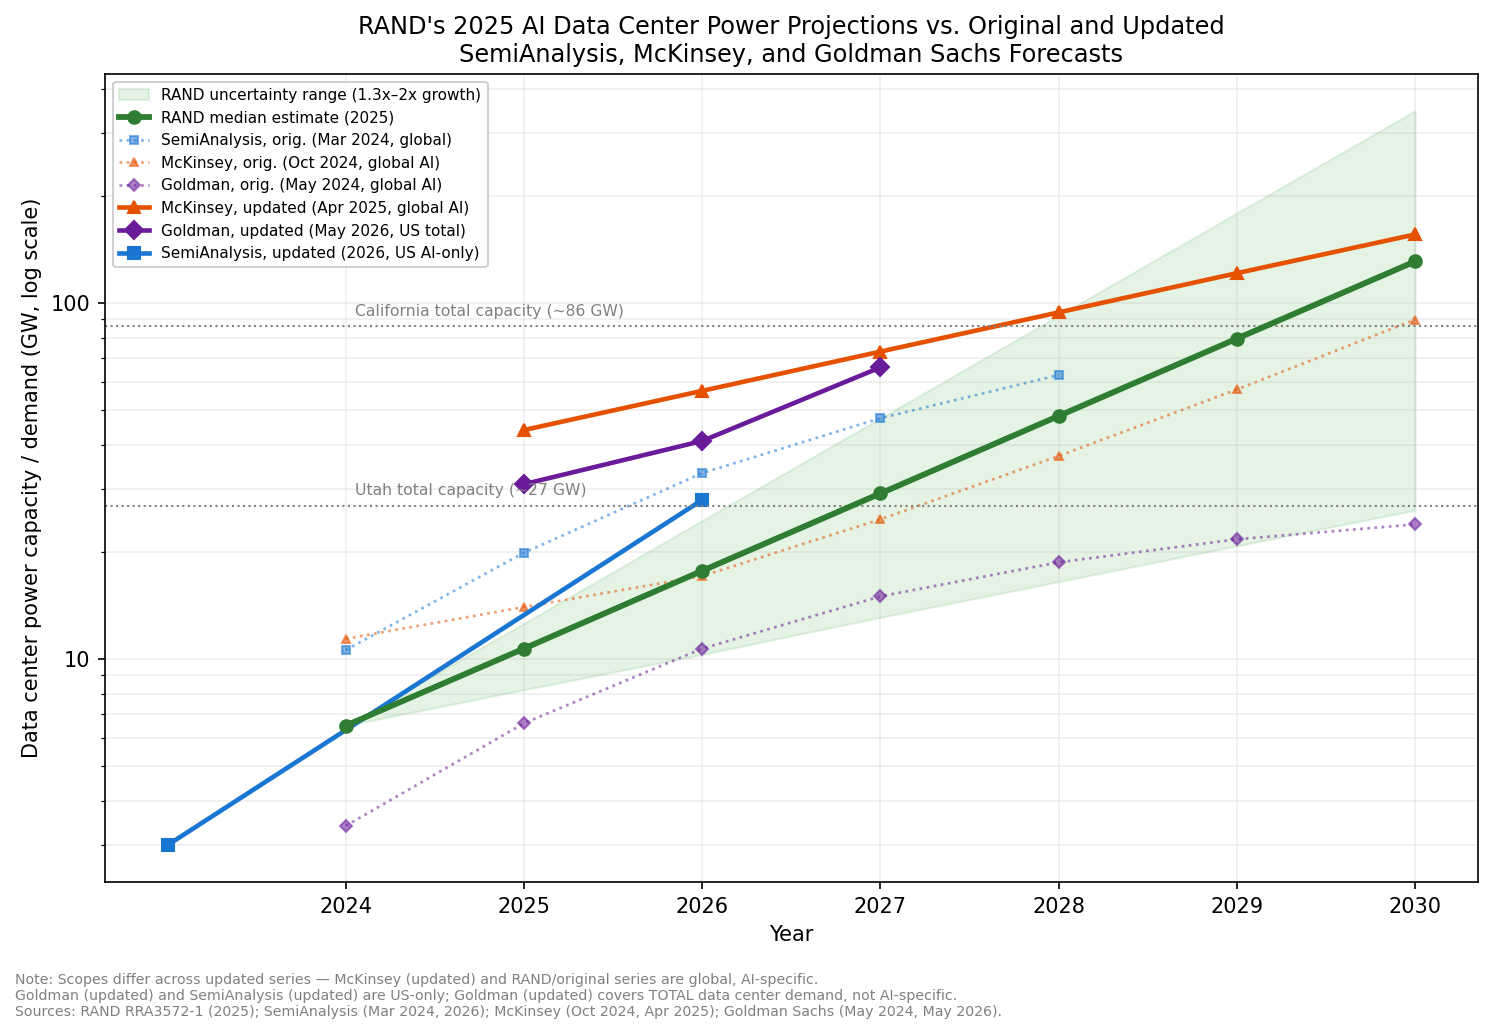
Update run of RAND 2025 v most recent reportings
Goldman: U.S. data center power demand is expected to climb from 31 gigawatts (GW) in 2025 to 41 GW in 2026 and 66 GW the year after.
SemiAnalysis: Their report “AI Datacenter Energy Dilemma - Race for AI Datacenter Space” forecast AI power demand in the US to grow from ~3GW in 2023 to over 28GW by 2026.
They note their prediction proved very accurate. They've since shifted focus to a granular, filing-by-filing capacity tracking rather than a single top-down projection. Their YE2026 North America Hyperscaler Self-build forecast only moved by ~1%, and North America colocation less than 5% over the past six months, per their most recent public writeup.
McKinsey: Global total demand growing at 22 percent per annum from 82.3 gigawatts to 219.0 gigawatts
So, Goldman and SemiAnalysis are the most recent reportings. Real estate analysts offer slightly different numbers, which I’ll tackle in a next iteration. But a convergence may be occurring here.
A global point to note: My run, by Claude, keeps a single, consistent scope throughout: global, AI-specific data center power capacity in GW, so RAND and both McKinsey vintages are directly comparable. The headline takeaway — McKinsey's 2030 figure jumped from ~90 GW to ~156 GW in six months, a ~73% upward revision — and now converges much closer to RAND's own 131 GW median estimate.
Admittedly, this is sheer agony to parse. Takeaways follow:
1) The global scene appears to have increased considerably since 2024 and 2025. Announcements bear this out.
2) The U.S. landscape is becoming more difficult to project even though the set up with power and other supply chains inputs is more favorable.
3) The real color of the movement, while hard to predict the diffusion of AI tech’s timeline, is partly specific to industry use case adoption. Top tech firms are prime movers and beneficiaries with know-how. There is increasingly more movement ahead however with an unknown pacing of adoption.
With governors, such as energy procurement, moratoriums, and capital limitations, a dark fiber era-type oversupply situation like the dot-com boom is expected to be avoided. Agentic AI is only in play one year now. On the physical side of the data center, incredible work and innovation is occurring and ahead.
Final Thoughts
The technology storyline offers the most apparent color on investment directions and how the layers of the AI puzzle are distinctive but also overlapping. Innovation isn’t a straight scaled line.
The economics of the AI buildout have been essentially supporting the lion’s share of economic growth in the U.S. in the last year. Anecdotal evidence is strong from a deeper dive into the regions within the U.S. The economic gains being spread are positive.
The geography of the AI movement, once more easily pegged, is becoming more diffused as adoption continues and fragments for many reasons. A deeper dive into the infrastructure dynamics offer more clues and some prospects about scaling theories which may become more relevant in the future.
In Texas, with some projects on pause, whispers are that politics and fear of making the wrong call are current obstacles in places. The overall climate is making the opportunity for towns hoping to attract new development more challenged. A town in South Texas is facing such a task.
The next couple of years will be an interesting sorting, with better data in hindsight. Even good project developers are being challenged. The majority of the public is focused on the physical side of the buildout or the concern about AI technology in general. Real and balanced leadership will be required to navigate the challenges and allay fears, but allow for the opportunities.
Footnotes:
[i] I will address this more fully and specifically play the AI infrastructure shifts forward in future, focusing on resources such as energy, water and land.
[ii] Nasdaq Global Indexes, Sept 2026. “Powering the Nasdaq-100’s AI Thematic Engine…”
[iii] Among the four listed hyperscalers alone (Microsoft, Amazon, Google
and Meta Platforms), AI-related capex is approaching $800 billion in 2026 (based on reported
actuals in 1Q/2Q and company guidance for 3 Q/4Q).
[iv] See author for more early analysis of the topic. Also: https://seekingalpha.com/article/4829554-capacity-valued-in-ai-investment-equation
Important Histories and Milestones
Top two video document from May 2023, with LLMs/AI and Nvidia just hitting the scene in earnest. I project what this may mean. It is coming true. Followed by the Jan 2026 recap of a comprehensive feature about the AI buildout, with Tier 1 data center market Dallas a focal point. Sept 25 and Mar 2026: The second row are entrepreneurs who have found and evolved their business models to leverage AI and their competencies.