


World-wide, the state of greenhouse gas emissions is abysmal. The two following graphics sum up the state of greenhouse gas emissions (GHG): how much we are emitting and the sources of origin. GHG emissions increased from 27 to 49 gigatons of CO2 equivalent per year between 1970 and 2010; the last decade was the highest in human history, which is not surprising. A gigaton is equal to one billion tons.
The Intergovernmental Panel on Climate Change says:
Globally, economic and population growth continue to be the most important drivers of increases in CO2 emissions from fossil fuel combustion. The contribution of population growth between 2000 and 2010 remained roughly identical to the previous three decades, while the contribution of economic growth has risen sharply.
In Asia, GHG emissions rose by 330% over the last four decades, reaching 19 GtCO2eq/year in 2010. The Middle East and Africa's GHG emissions grew 70%, Latin America by 57%, and advanced economies by 22%. In absolute terms, international transportation contributes a relatively smaller amount of GHG emissions, but they are growing rapidly. The increased use of coal since 2000 has reversed the slight decarbonization trends, they note.

(AFOLU is agriculture, deforestation, and other land use changes, a second largest contributor to GHG emissions.)
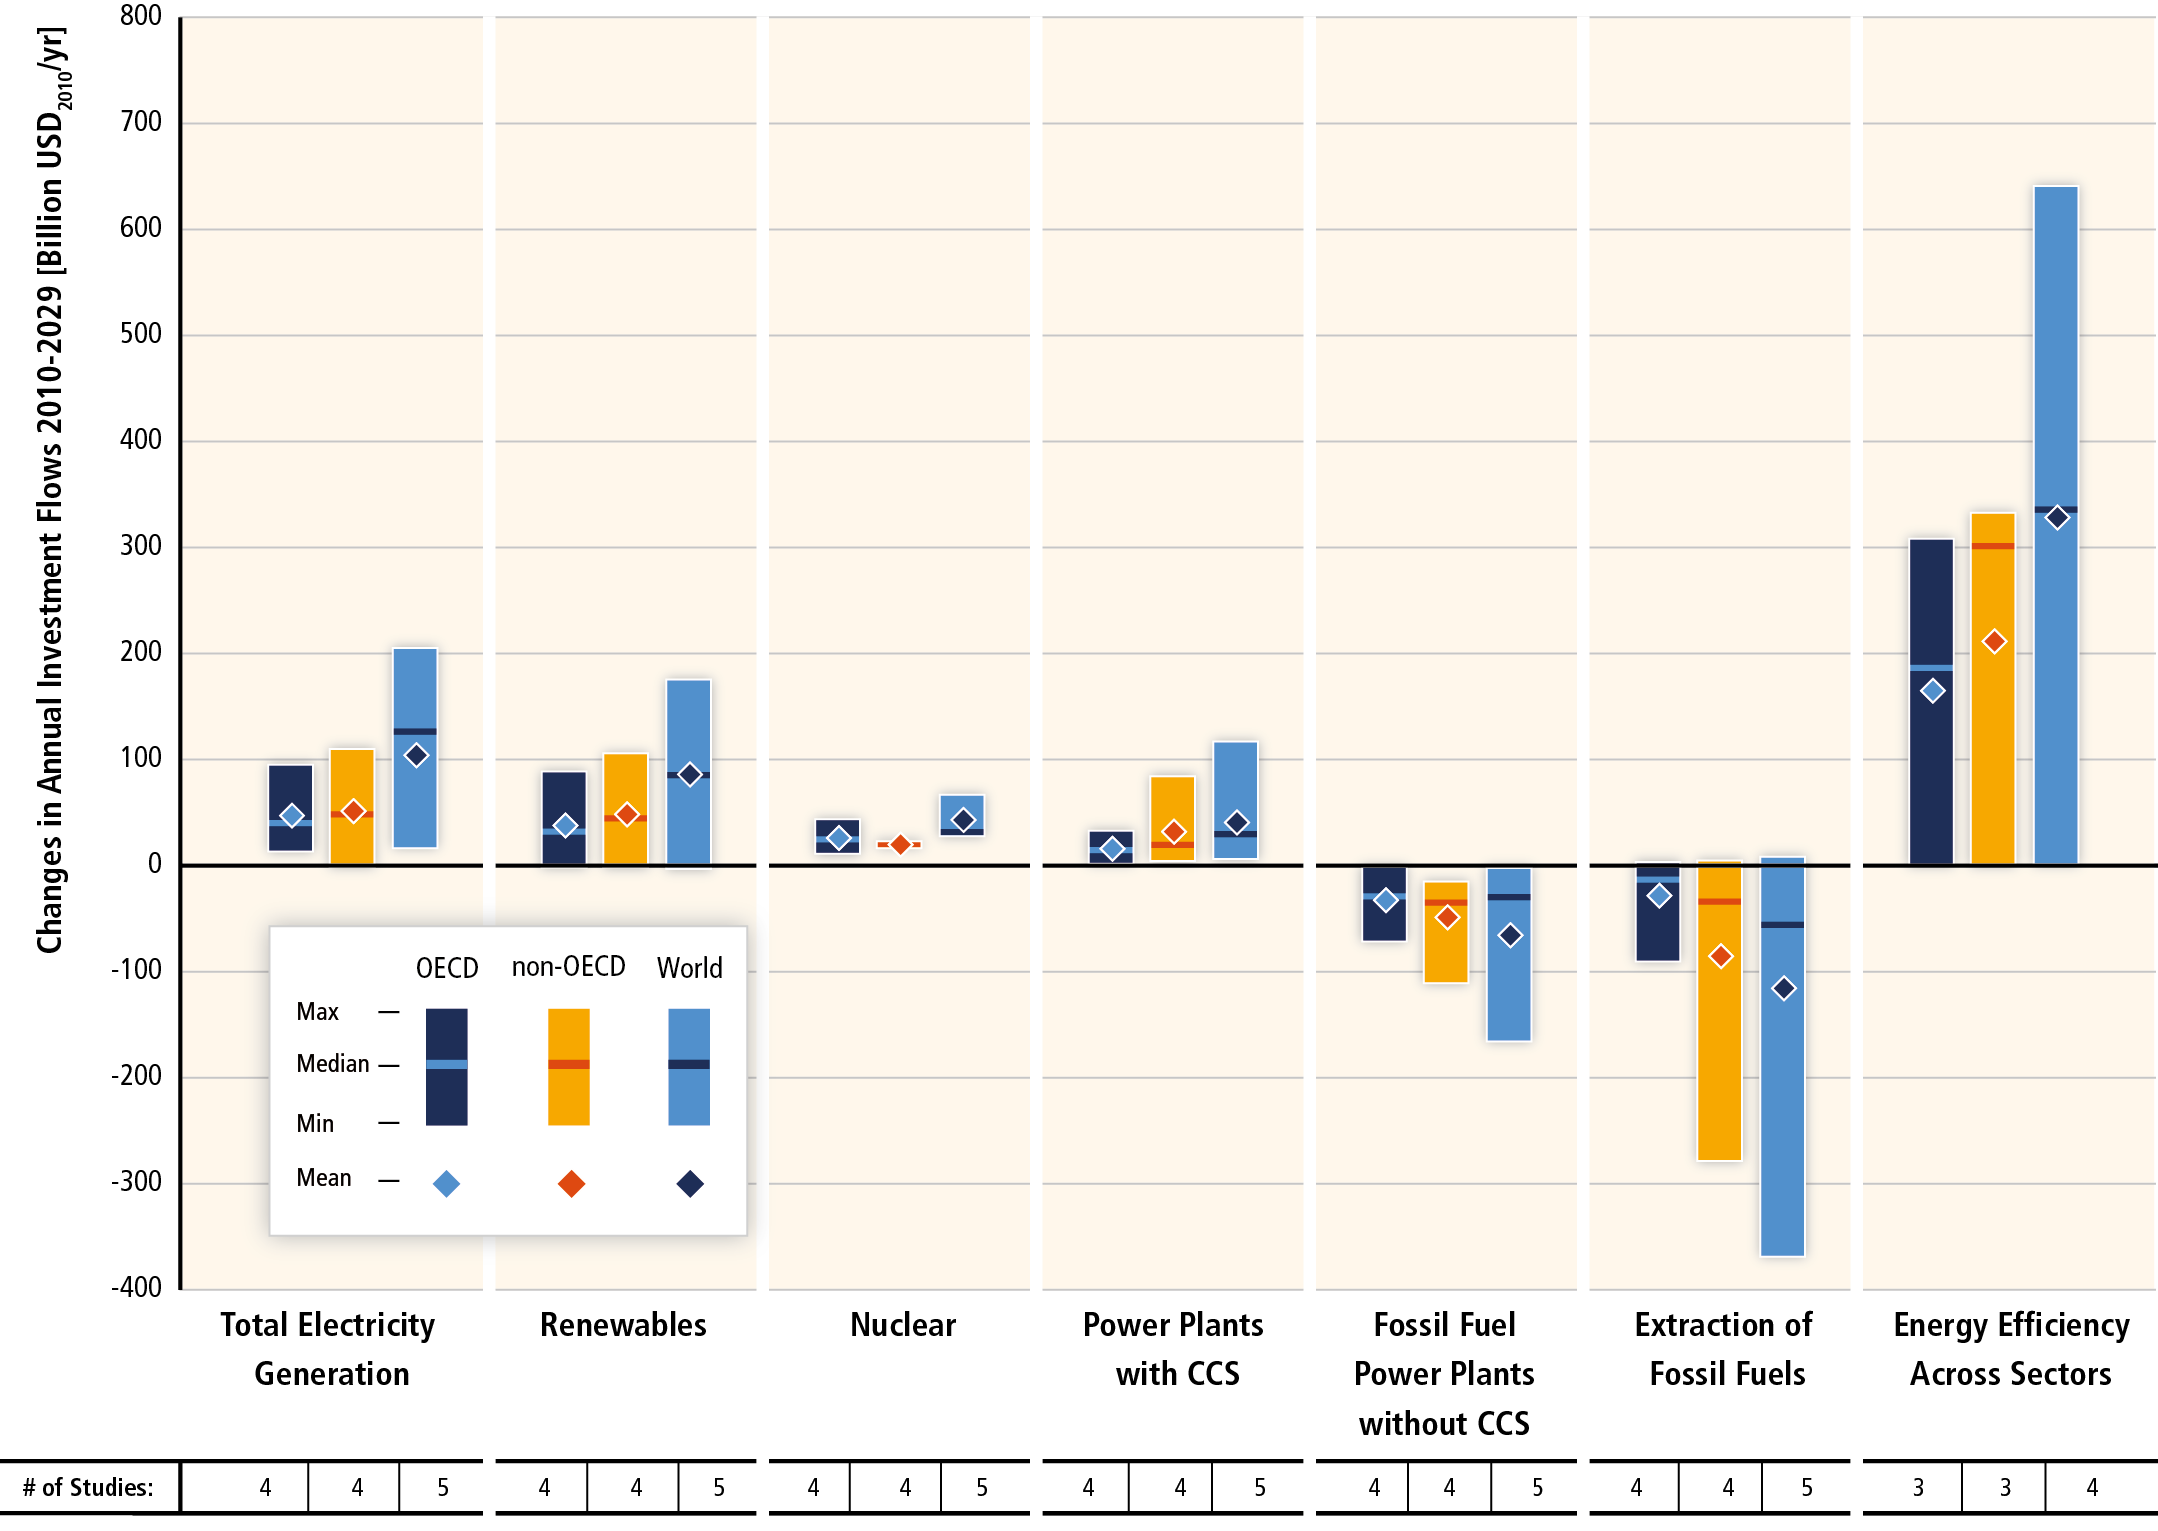
From an investment point of view, considerable reversals of investment in the non-OECD world would be needed to bring emissions into a range of stabilization in the "extraction of fossil fuels" category. Between the period 2010-2029, an average of approximately $300 billion per year, up to $600 billion, would need to be spent by both advanced and non-advanced economies in energy efficiency across sectors to stabilize emissions. Global total annual investment in the energy system is about $1.2 trillion. Annual incremental energy efficiency investments in transport, buildings, and industry is projected to increase by $336 billion, largely from modernizing equipment. (The charts are sourced from the IPCC's Fifth Assessment report, mainly from the Workgroup III section.)