
A joint energy conference hosted by the Dallas and Kansas City Federal Reserve Banks
Conference page.
Summary by Topic from Video Download from Federal Reserve Energy Conference
Monetary Policy & Economic Outlook
Italics is from energy edition work and what’s expected ahead.

Current stance: Monetary policy is moderately restrictive, though markets aren't acting like it (Kansas City Fed President Jeff Schmidt)
Inflation: Hovering around 3%, above the Fed's comfort level
IT spending: Reached 1.1% of GDP growth in first half of 2025 (mostly in Q2); highest on record except for Q1 2000 during dot-com boom
Productivity: Strong growth may be changing the neutral interest rate, possibly due to AI
Labor market challenges: Boomer retirements and reduced immigration limiting growth
Tariffs & Global Trade
Tariff rate: 18% in 2025, higher than most historical high-tariff eras.
Trade impacts: Creating uncertainty for business planning; countries finding substitutes rather than retaliating.
Emerging markets: Outperforming, possibly due to new trading partners and improved trade policies.
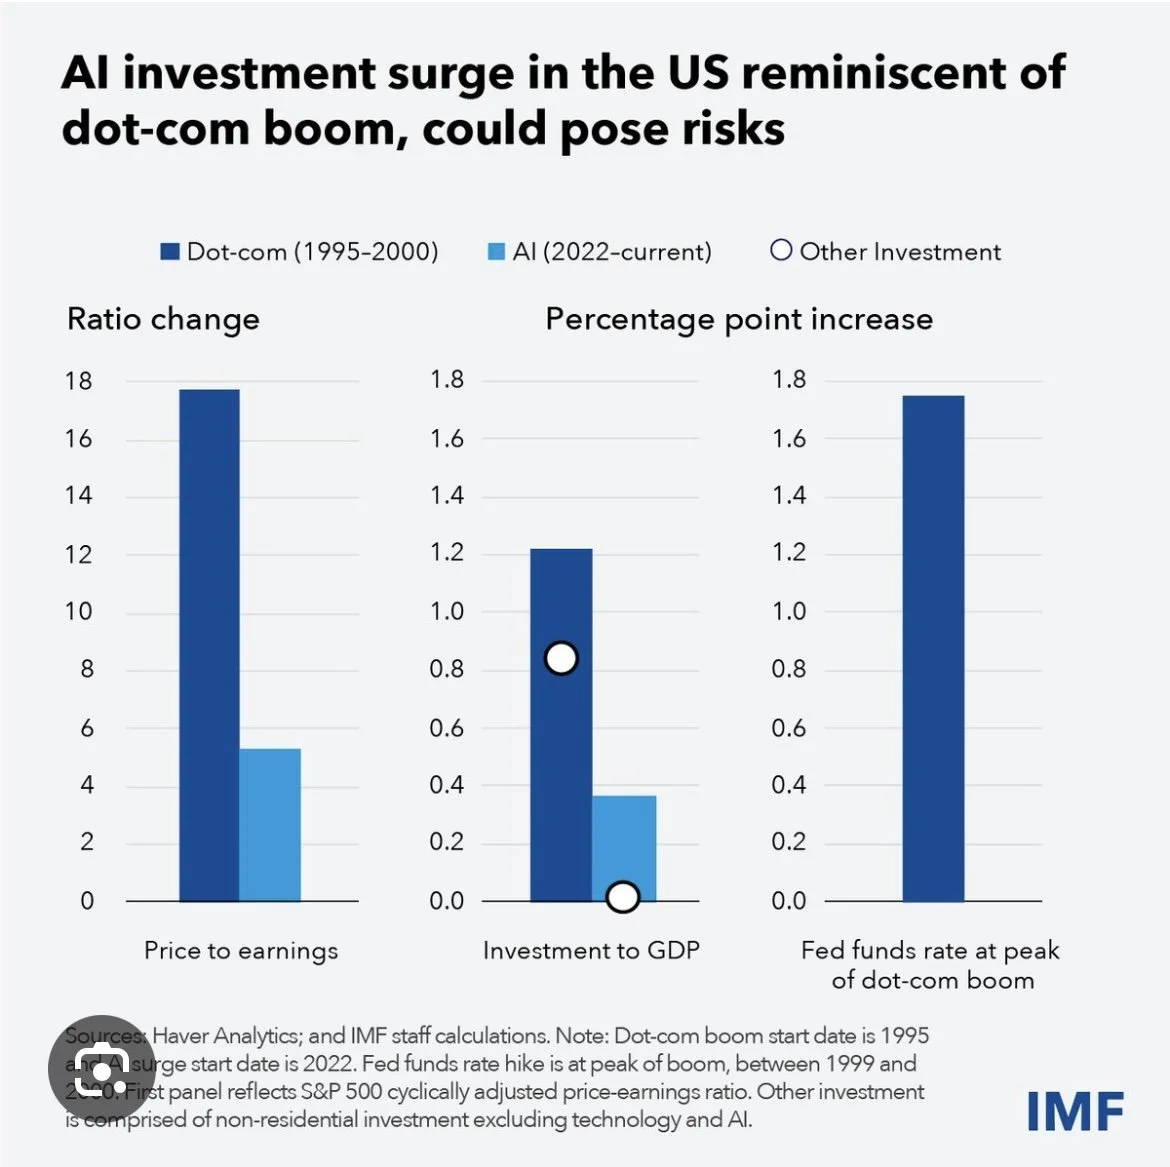
AI-related investment 2025
In the first half of 2025, it was 1.1% of GDP growth, BUT much of that happened in the 2nd quarter, according to the economist that first presented this at SMUCOX’s TexCap event. I ran into her and we discussed the data.
AI Boom vs. Dot-Com Boom Comparison
Price-to-earnings: 18:1 (1995-2000) vs. 4-5: 1 (2022-present)
Investment to GDP: 1.1% (dot-com era) vs. under 0.4% (AI era)
Key difference: During dot-com, other investment occurred in parallel; now AI spending dominates with negligible other investment
"Dutch disease" concern: Certain sectors carrying the economy at expense of everything else
Questions remain: Do we need all this AI capacity? Who pays for it? What's the ROI?
Oil & Gas Outlook
Peak oil revised: Oil and liquids may not peak before 2050 (vs. previous estimates of 2030 peak)
Texas exports: $220 billion in energy exports
Pipeline construction: 45 BCF per day under construction (22 going to Gulf Coast)
Capacity growth: 6 million barrels per day in crude oil and liquids
Current conditions: Low inventories could lead to price tightness
Productivity gains: More productivity per well through traditional data analytics (not AI)
Basin strength: Underestimation of shale growth; basins strong despite recent oil price slide
Natural Gas & LNG
LNG growth: 6.9% cumulative annual growth from 2024-2030
Third wave buildout: 2026-2032, then slower growth (1% after 2030)
Current capacity: 18 BCF per day devoted to LNG
Projected growth: To 40 BCF per day over next several years
Supply dynamics: New LNG facilities beget their own supply growth
Market cyclicality: Natural gas showing less cyclicality compared to past, possibly due to global gas trade
Haynesville play: Western Haynesville could have 25 TCF, ideally positioned for Gulf Coast LNG
Global LNG & Select Demand Drivers
China: Residential and industrial demand
India: All user types; demand for infrastructure to unlock economic activity
Southeast Asia: Thailand, Bangladesh showing general top-line growth
Grid & Utility Infrastructure
Utility capex: 33 top utilities spending $1 trillion through 2029
Duke: Over $80 billion
NextEra: Over $70 billion
Southern: Similar to NextEra
XEL: $40 billion
AEP: Over $50 billion
NextEra specifics: $40 billion for Florida Power & Light; capex now, earnings growth driving through post-2035
Infrastructure lifespan: Average 55 years; nuclear facilities being expanded to 70+ years
Enbridge opportunities: $50 billion in growth opportunities through 2030

How Long to Get Connected
Interconnection Queue Challenges
Long timelines: Getting worse due to high demand
SPP grid: 70 months average
PJM: Problematic
ERCOT: Business as usual, couple of years
Mismatch: Between supply wanting to connect and grids’ capacity
Behind-the-meter interest: Due to bottlenecks, but true "power islands" not happening
Texas Energy Landscape (ERCOT)
Current peak demand: 85 gigawatts during summer
Projected growth: 105-110 gigawatts by 2030 (not full 156 gigawatts requested)
SB6 legislation:
Improving interconnection queue rationality
Requiring large loads to curtail during peak demand
Large loads may help pay for grid upgrades
Large load requests: "energized" amount much smaller than projections
Texas role: Anchors U.S. energy leadership
Responsiveness: Texas and Oklahoma basins most responsive for oil and gas growth
Data Center Demand
Natural gas demand breakdown (BCF):
LNG and Mexico exports: 23 BCF (baseload)
Power gen: 11 BCF
Data centers: 7 BCF
Coal-to-gas switching: 24 BCF per day, expected in Appalachia and Southeast
State-by-state variation: Energy picture varies significantly by state (Virginia and Texas have high data center growth, but for different reasons)
Load projections: Gradual growth in data center load from 2024-2030+ in Texas, with stable industrial growth
Three-year backlog: On natural gas turbines
Diesel increase: Due to turbine backlog, affecting backup generators (not environmentally clean)
Data Center developments

Improved planning: More coherent coordination between data center building and energy connection
Hyperscaler learning curve: Tech companies learning about energy permitting, licensing, physics, and slower timelines
Long-term assets: Data centers are 20+ year assets; grid remains important for risk mitigation
Behind-the-meter reality: Some behind-the-meter solutions, but true power islands unlikely
Rate structures: Utilities need new tariff structures; residential ratepayers shouldn't subsidize data centers
Virginia example: Dominion looking at new rate class for data centers
Demand drivers: Firms less rate-sensitive (hyperscalers, big tech) driving structural change
Market Structure & Future Outlook
Execution matters: Many announcements, but execution is what counts
Structural changes: Affecting both economic growth and productivity
Energy demand reality: Very real but nuanced; not just about U.S. AI power demand
Market sorting: Demand will be sorted out by market forces over time
Fed operations: Moved $5-6 trillion daily during government shutdown, demonstrating independence